
What not to expect
The frequency of unplanned pregnancy in America
When you get an IUD and hear it's 99.9% effective, pregnancy seems like a total impossibility, but like all statistics, .1% is always someone's experience.
In February 2021 I took three pregnancy tests convinced after every subsequent positive test, the next would be negative because I had an IUD, and pregnancy should have been an impossibility. In fact, it was twins. My IUD was possibly the most faulty ever made. I chose motherhood, but really engaging with the option of abortion helped me see motherhood as something I chose, when given different circumstances many others may not feel this way. I would hope anyone else experiencing an unplanned pregnancy has the same freedom to choose.
Despite knowing exactly how numerically unlikely my situation was and is, I wanted to get an idea of exactly how many women in America have to choose whether or not to become a mother, under the duress of already being pregnant.
To find my data I turned to the CDC's National Survey of Family Growth. It surveys thousands of women in the US over a three year period on their contraceptive choices, and experiences with pregnancy. I then applied these patterns to the entire US population of women between the ages of 15 and 49, or as the US Census Bureau puts it, "the fertile population".
How common is an unplanned pregnancy?
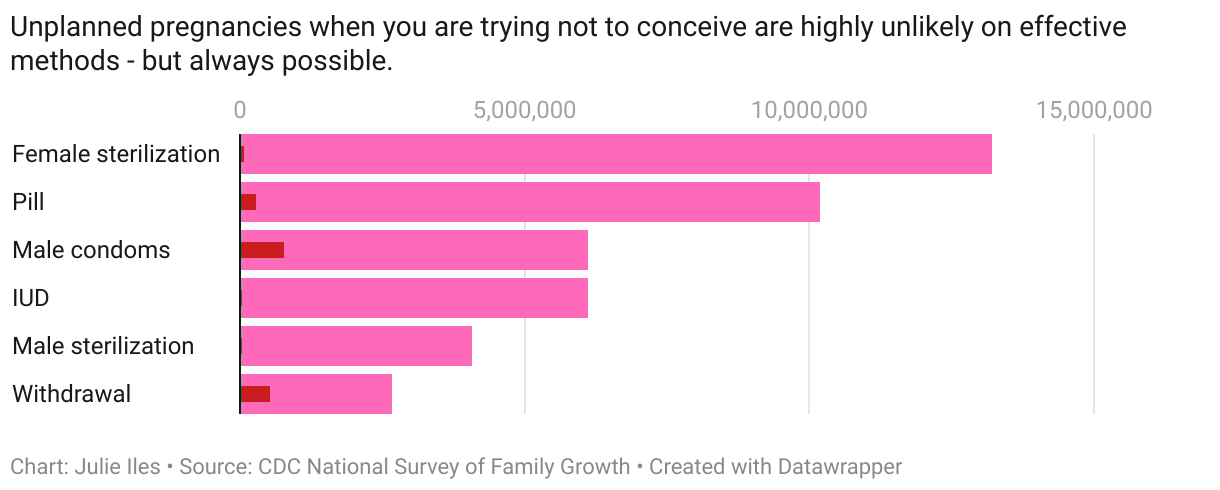
Across the whole population of women 15-49 years old in the US, unplanned pregnancies account for over 3.6 million pregnancies every year - and 1.6 million of these are people who were actively trying to prevent a pregnancy.
Far fewer women are using IUDs and their partner's vasectomy to prevent pregnancy despite them being many times more effective than condoms or the pill. As this graph shows IUD failure barely even registers in the grand scheme of things.
Unplanned pregnancies

I compared what the failure rates were for each different birth control method (even the weird ones) to see how many cases of unplanned pregnancy there would be in 1000 users of each method. As you can see, I'm all alone up there, so those of you with IUDs out there can probably relax.
IUD Brand and failure over time
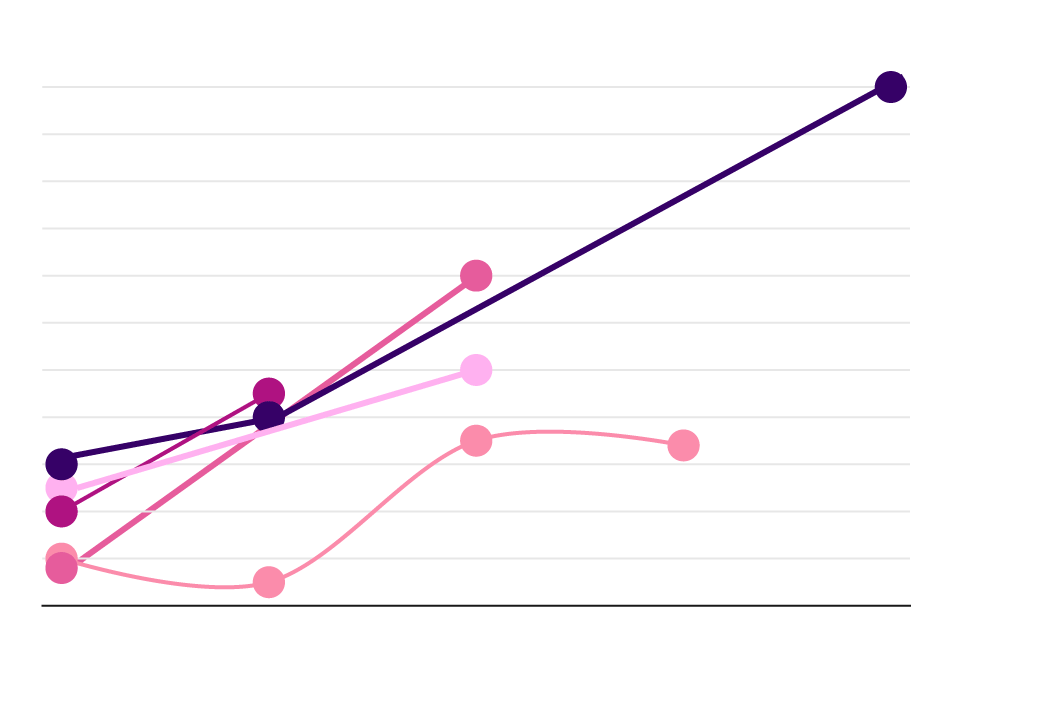
IUD failures per 1000 users by brand
22
Paraguard
Copper
20
18
16
Kyleena
14
12
10
Skyla
Liletta
8
6
Mirena
4
2
0
After 1 year
After 3 years
After 5 years
After 8 years
After 10 years
Chart:
Julie Iles
•
Source:
Clinicaltrials.gov
•
Created with
Datawrapper
This analysis shows IUDs fail more often over time, and that the Mirena is your safest bet, though again, all IUDs are statistically better contraceptives than all other methods of birth control, except for surgical sterilisation. I got pregnant using a Skyla IUD (or Jaydess as it is known in Europe and New Zealand) needless to say I've switched brands.
Increasing pressure on a shrinking number of abortion clinics
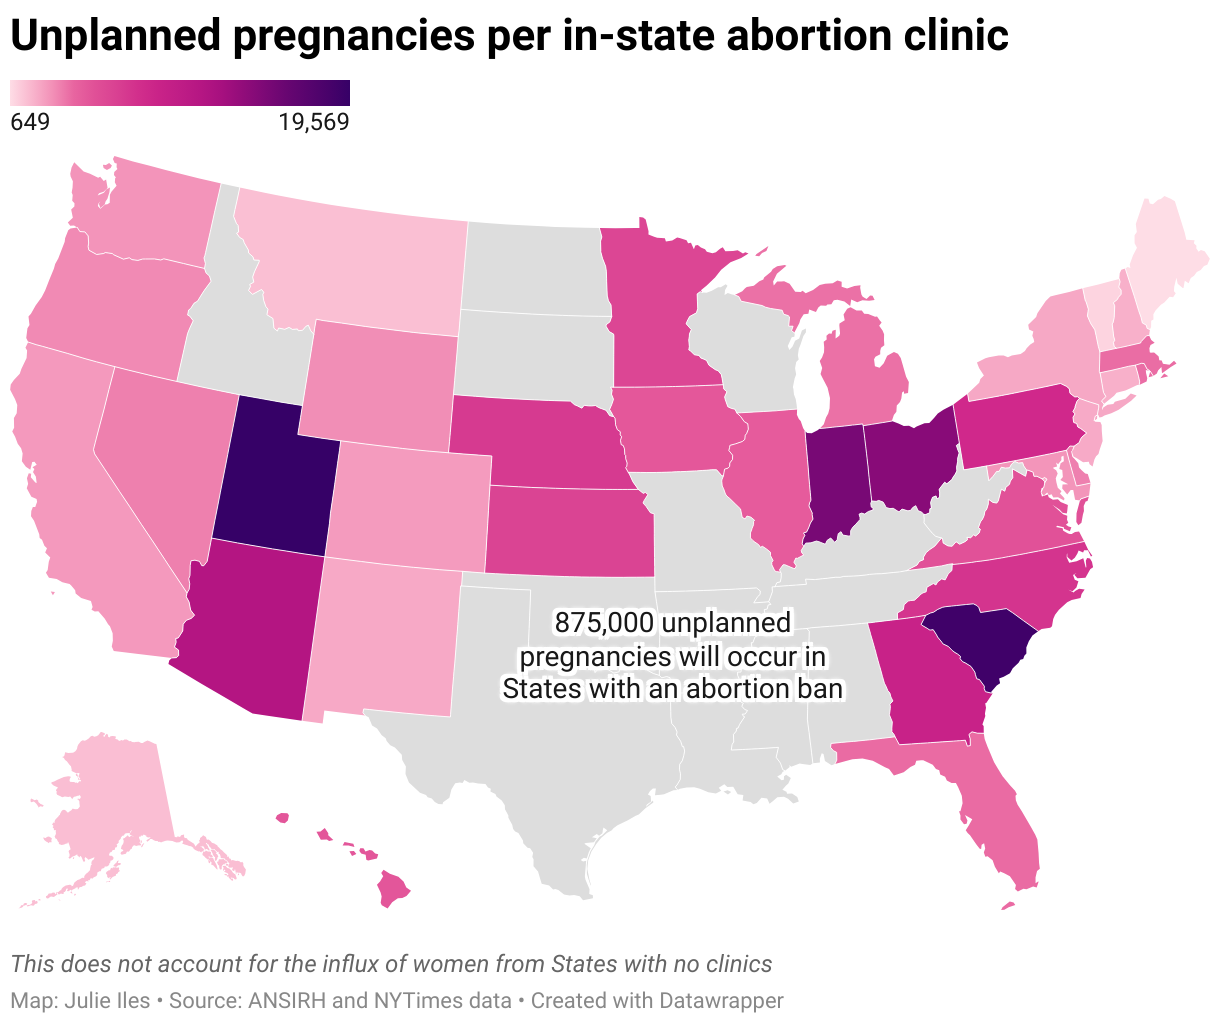
I updated the ANSIRH Abortion Facility Database with the recent reporting by The New York Times on abortion services clinics closure or cessation of services in the last year.
Extrapolating the amount of unplanned pregnancies at the state-level as a gauge of demand for abortion might be better than ANSIRH's current metric of all women in the area between 15 and 49 for determining demand on a per-aborotion-clinic basis. This analysis clearly shows even many states where abortion is legal are ill-suited to offer women local and timely access to abortion if they need it. This analysis worryingly shows that many states are overwhelmed by their own populations, and would be even more overwhelmed with the influx of out-of-state demand. It is even worse still how many of the most-overwhelmed states are those that border the black-hole of abortion access that is the Southern United States.
Notebook analysis can be found here